List of cities by murder rate
The following 50 cities have the highest murder rates in the world of all cities not at war, with a population of at least 300,000 people, and all relevant data available online.[1][2] The murder rate of a city is an imprecise tool for comparison, as the population within city borders may not best represent an urban or metropolitan area with varying rates in different areas.

Tijuana, Mexico, the most murderous city in the world per capita.

Cape Town, South Africa, the most murderous city in the world by death toll.
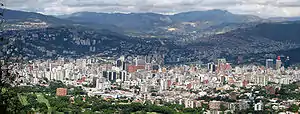
Caracas, Venezuela, the most murderous city in South America.
All but 4 of the top 50 cities are in the Americas, with the remainder in South Africa.
| Rank | City | Country | Homicides (2019) | Population (2019) | Homicides per 100,000 per year |
|---|---|---|---|---|---|
| 1 | Tijuana | 2,367 | 1,763,197 | 134.24 | |
| 2 | Juárez | 1,522 | 1,455,923 | 104.54 | |
| 3 | Uruapan | 301 | 351,823 | 85.54 | |
| 4 | Irapuato | 723 | 895,515 | 80.74 | |
| 5 | Obregón | 281 | 348,154 | 80.72 | |
| 6 | Caracas | 2,134 | 2,858,933 | 74.65 | |
| 7 | Acapulco | 600 | 837,914 | 71.61 | |
| 8 | Cape Town | 3,065 | 4,488,545 | 68.28 | |
| 9 | St. Louis | 194 | 300,576 | 64.54 | |
| 10 | Vitória da Conquista | 205 | 341,597 | 60.01 | |
| 11 | Baltimore | 348 | 593,490 | 58.64 | |
| 12 | Ciudad Guayana | 462 | 799,255 | 57.80 | |
| 13 | Kingston | 680 | 1,180,771 | 57.59 | |
| 14 | Feira de Santana | 349 | 614,872 | 56.76 | |
| 15 | San Pedro Sula | 436 | 789,645 | 55.21 | |
| 16 | San Juan | 172 | 318,441 | 54.01 | |
| 17 | Ensenada | 275 | 527,584 | 52.12 | |
| 18 | Ciudad Bolívar | 189 | 370,627 | 51.01 | |
| 19 | Cuernavaca | 470 | 923,274 | 50.91 | |
| 20 | Celaya | 262 | 526,166 | 49.87 | |
| 21 | Culiacan | 472 | 955,340 | 49.41 | |
| 22 | Natal | 645 | 1,334,817 | 48.32 | |
| 23 | Salvador, Bahia | 1,657 | 3,490,792 | 47.47 | |
| 24 | Nelson Mandela Bay (Port Elizabeth) | 553 | 1,207,485 | 45.80 | |
| 25 | Cancún | 376 | 825,647 | 45.54 | |
| 26 | Cali | 1,176 | 2,599,468 | 45.24 | |
| 27 | Rio Branco | 183 | 407,319 | 44.93 | |
| 28 | Caruaru | 160 | 361,118 | 44.31 | |
| 29 | Guatemala City | 1,420 | 3,265,546 | 43.48 | |
| 30 | Zacatecas | 151 | 351,397 | 42.95 | |
| 31 | Barquisimeto | 489 | 1,161,709 | 42.11 | |
| 32 | Chihuahua | 391 | 937,233 | 41.70 | |
| 33 | Distrito Central (Tegucigalpa) | 516 | 1,259,646 | 40.96 | |
| 34 | Detroit | 273 | 670,031 | 40.74 | |
| 35 | Durban | 1,577 | 3,890,001 | 40.54 | |
| 36 | Manaus | 878 | 2,182,763 | 40.22 | |
| 37 | Palmira | 124 | 312,507 | 39.68 | |
| 38 | Morelia | 325 | 819,361 | 39.65 | |
| 39 | Ciudad Victoria | 139 | 363,577 | 38.27 | |
| 40 | Guadalajara | 1,932 | 5,073,583 | 38.07 | |
| 41 | Reynosa | 248 | 679,229 | 36.57 | |
| 42 | Johannesburg | 2,078 | 5,738,536 | 36.21 | |
| 43 | Minatitlán | 132 | 369,213 | 35.75 | |
| 44 | Cúcuta | 303 | 852,014 | 35.56 | |
| 45 | Recife | 1,422 | 3,999,817 | 35.55 | |
| 46 | Valencia | 486 | 1,371,267 | 35.41 | |
| 47 | León | 697 | 1,987,335 | 35.07 | |
| 48 | Maturin | 184 | 526,243 | 34.98 | |
| 49 | Fortaleza | 1,365 | 3,959,923 | 34.47 | |
| 50 | Maceió | 347 | 1,018,948 | 34.05 |
By country
| Country | No. of cities |
|---|---|
| 19 | |
| 10 | |
| 6 | |
| 4 | |
| 4 | |
| 3 | |
| 2 | |
| 1 | |
| 1 | |
See also
- Firearm death rates in the United States by state
- Homicide in world cities
- List of Brazilian states by murder rate
- List of countries by firearm-related death rate
- List of countries by intentional death rate - homicide plus suicide.
- List of countries by intentional homicide rate by decade
- List of countries by intentional homicide rate
- List of countries by life expectancy
- List of countries by suicide rate
- List of federal subjects of Russia by murder rate
- List of Mexican states by homicides
- List of U.S. states by homicide rate
- List of United States cities by crime rate (2014). 250,000+
- Number of guns per capita by country
- Right to keep and bear arms in the United States
- United States cities by crime rate (100,000–250,000)
- United States cities by crime rate (60,000-100,000)
Sources
- "List of cities by murder rate". seguridadjusticiaypaz.org.mx. Retrieved 1 June 2020.
- "50 of the most dangerous cities in the world". usatoday.com.
This article is issued from Wikipedia. The text is licensed under Creative Commons - Attribution - Sharealike. Additional terms may apply for the media files.